
US Dollar Weekly Report – 28 May 2024
USD UPDATE: EUR/USD (Daily)
|
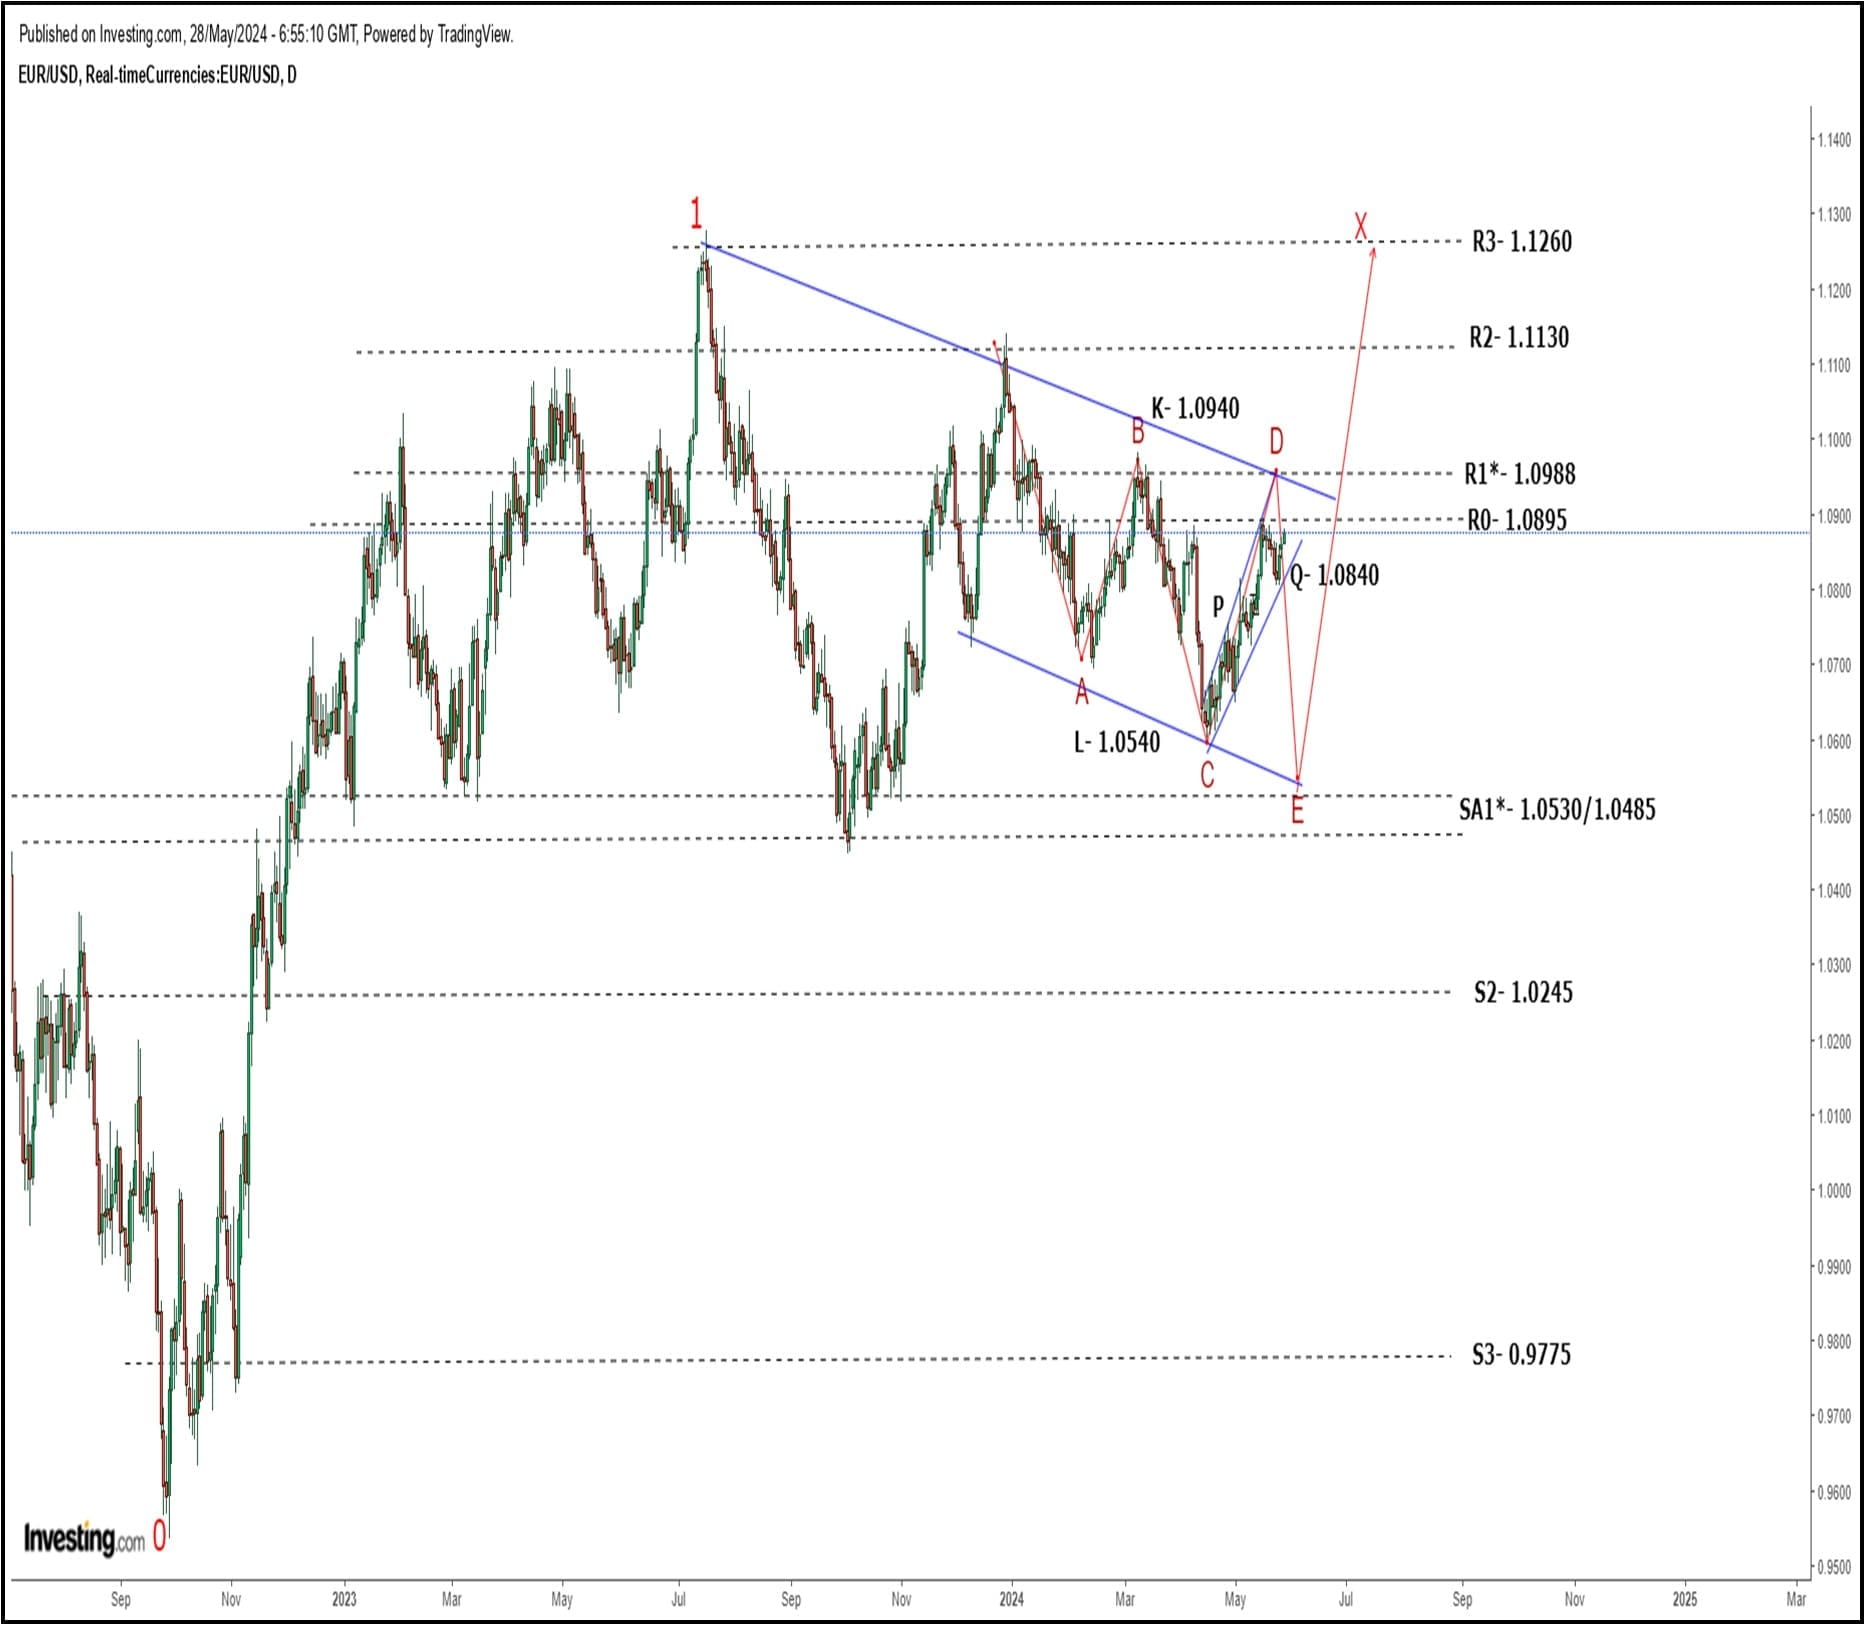
The illustrated view of KL downside to SA1**, followed by gains to R3, remains valid. This should be part of the larger R3/SA1** consolidation phase.
- The PQ defined gains seems corrective, supporting the interim view of downside off the R0/R1* resistance area to SA1** . This move will likely complete the KL formation.
- Important SA1** support is expected to hold during KL defined downside, followed by meaningful gains back to R2 and R3.
- The negation level for the expected bear phase is at R1*. This will pivot the market to larger bullish potential to R2
Target and re-assessment levels
| Important levels | SA1** and R1* |
| Primary trend | Gains off SA1** to R2 and R3 |
| Monthly Range | K/L |
| Prevailing trend | Downside off R1* to SA1** |
| Technical rating | Medium |
USD UPDATE: USD INDEX (Daily)
|
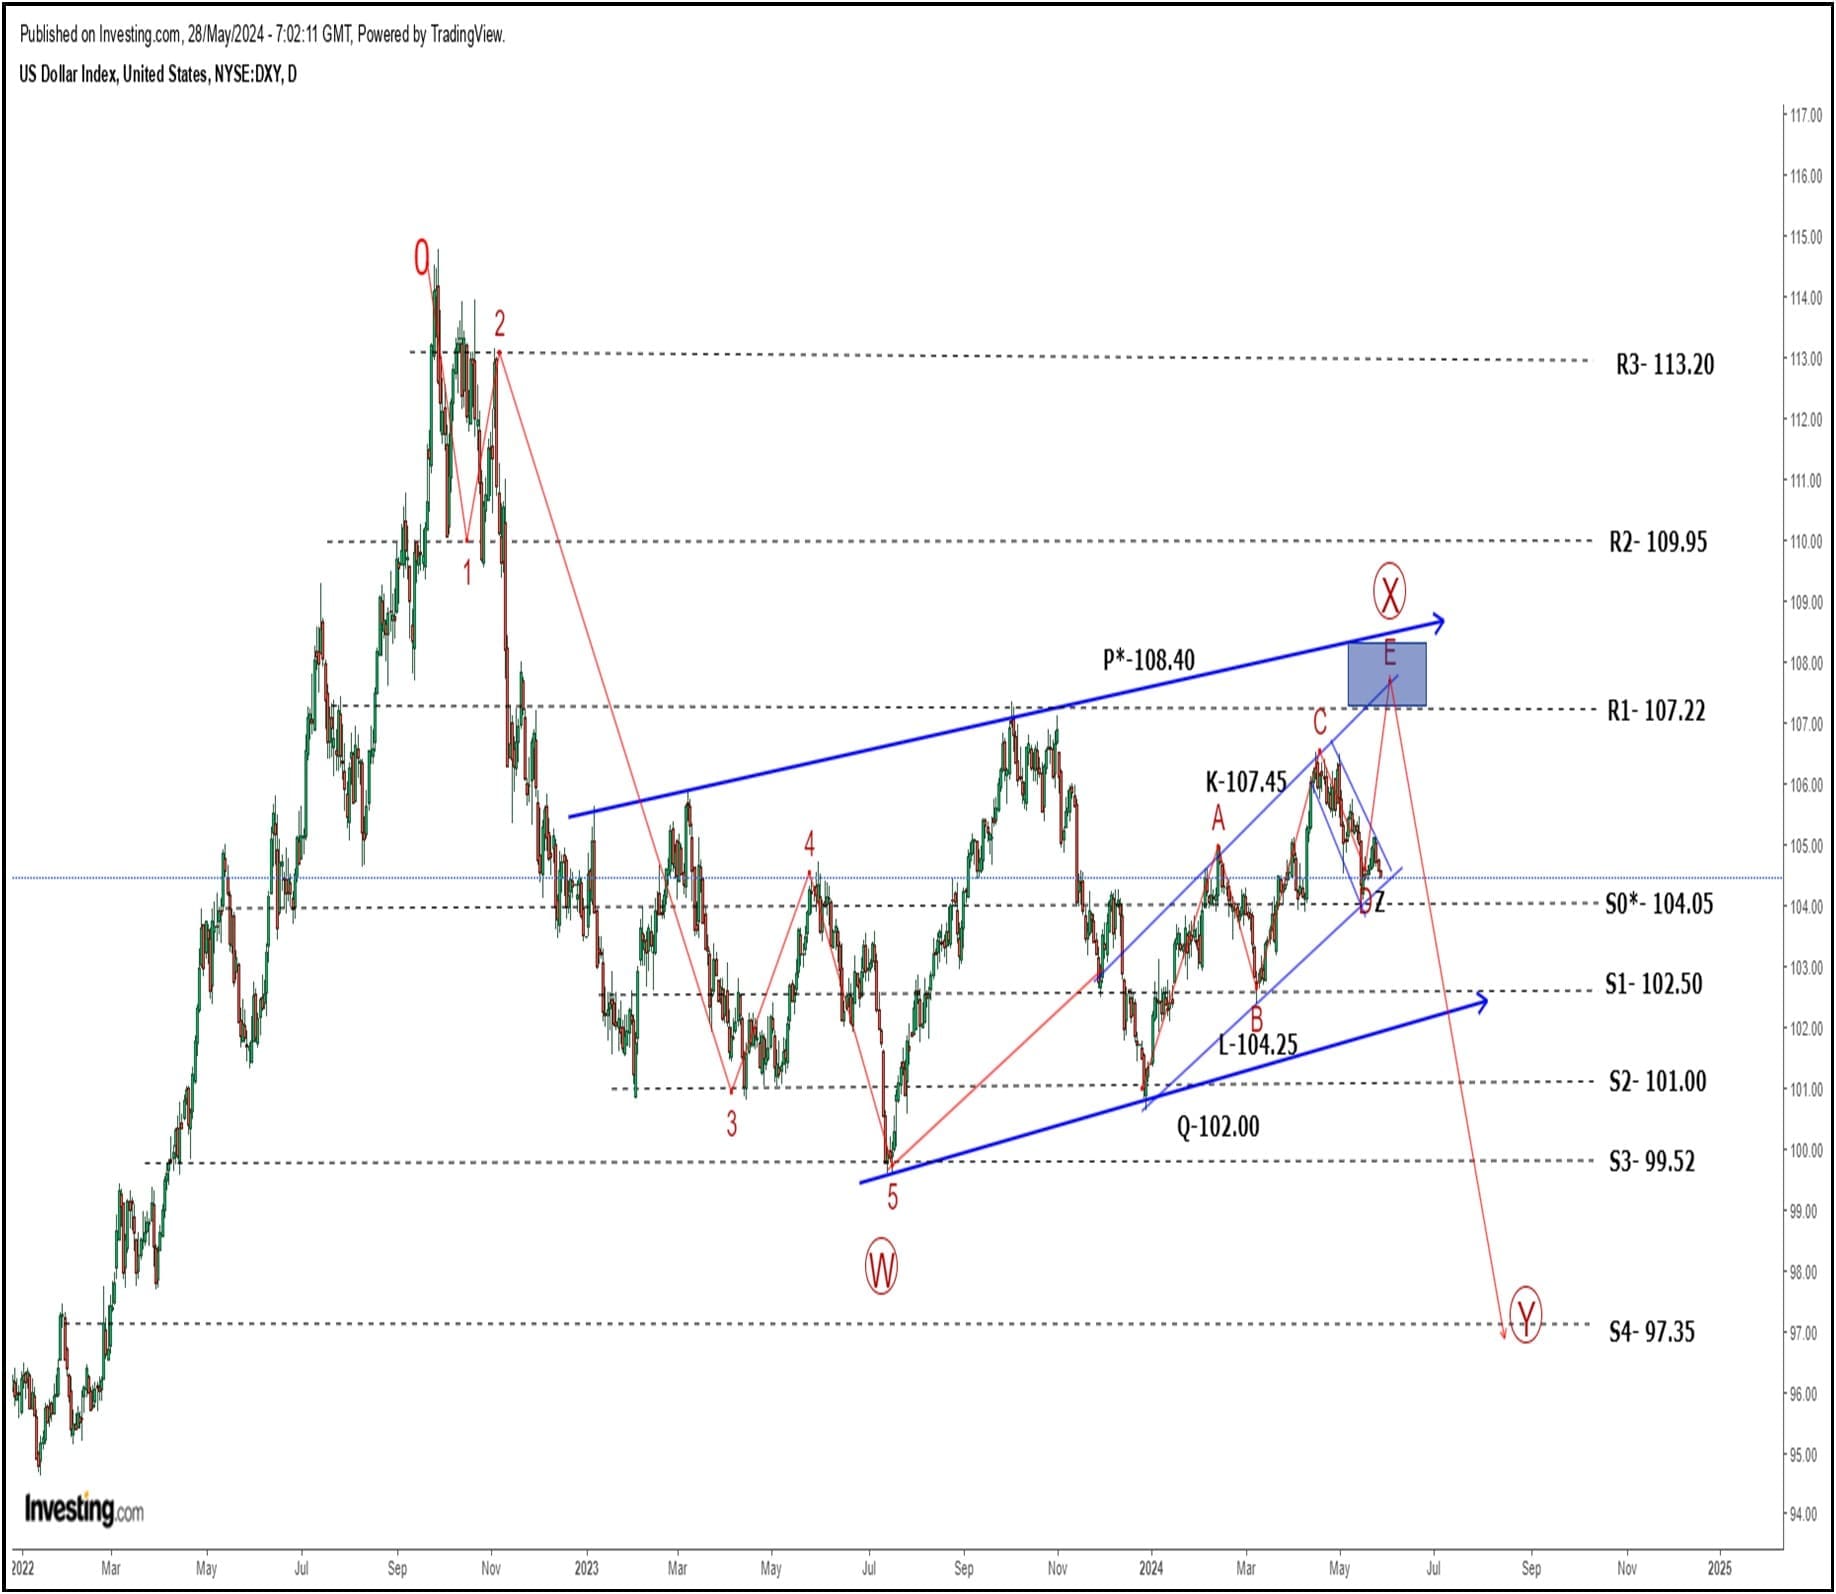
General view: The illustrated WXY downside that started at point 0 remains valid and should be followed by final downside to S4.
Medium term: The PQ flag formation is forming phase X of the WXY downside. Overlapping price action within PQ, as well as the current KL channel supports the general view.
- The current Z range seems like a flag continuation pattern, as part of the larger upside to K and P to complete X.
- A break below S0* will activate the downside.
Note: Many interim alternatives remain possible and the view is of medium to low conviction.
Target and re-assessment levels
| Important Levels | P* and S0* |
| Primary trend | Downside off K/P* to S4 |
| Monthly Range | K/L* |
| Prevailing trend | Final gains to R1 and K |
| Technical rating | Medium to low |
USD UPDATE: USD INDEX (5 Hour)
|
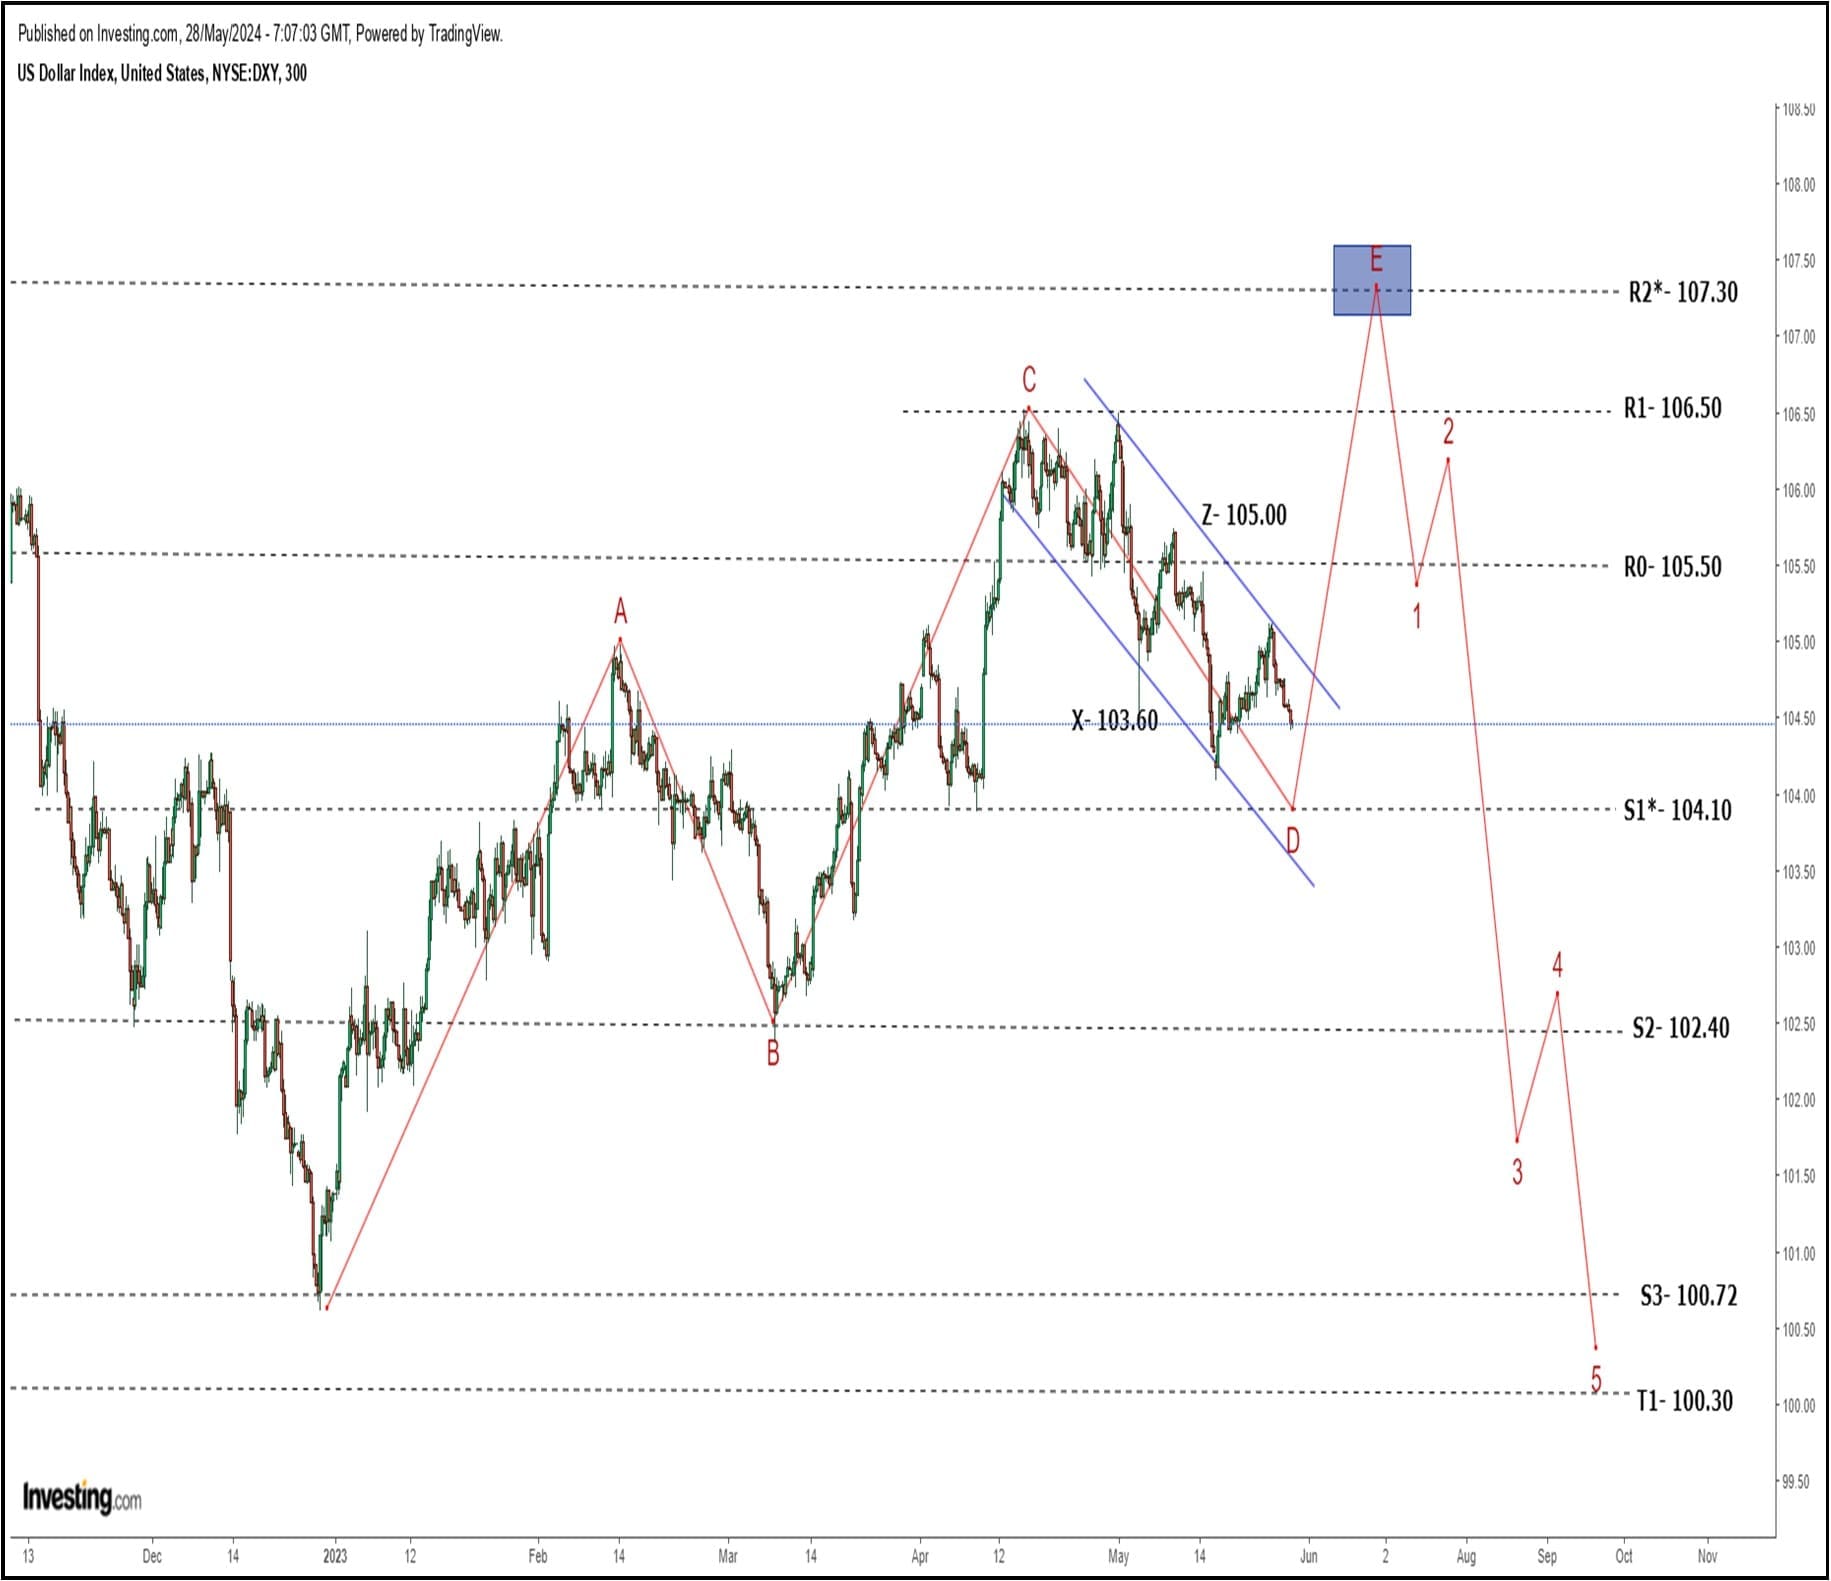
The general view of gains to R2*, followed by a bear trend to T1, is retained.
- Overlapping upside from the bottom at S3 supports the view that it is a correction in a larger bear trend (see daily analysis).
- The current ZX consolidation is also corrective and potentially phase D of the ABCDE interim bull phase to R2*. A break of Z will activate the upside potential.
- Below S1* will neutralize phase E upside and pivot the market to a more interim bearish bias. R2* is the bullish level that needs to hold.
- downside.
Target and re-assessment levels
| Important Levels | R2* and S1* |
| Primary trend | Gains to R2*, followed by downside to S3 and T1 |
| Weekly Range | Z/S1* |
| Prevailing trend | Gains off S1* to R0 |
| Technical rating | Medium |
This report is for informational purposes only, does not constitute an offer, or solicitation to trade and should not be construed as a recommendation, or advice, to enter into, or to refrain from entering into, any transaction.
Whilst the information herein contained is believed to be reliable, no responsibility is assumed by Hite Investments and Consulting, (Pty) Ltd., their employees, associates, external contributors, or any of the references used, for any errors, or omissions, or for losses of any nature which may arise from any opinion expressed herein.
You are cautioned that information is not necessarily complete and that opinions of individuals employed at the above may differ, or be based on contrary analysis techniques andthat opinions may change over time.
The losses in trading and investing can be substantial and you should not engage in such trading and investing unlessyou fully understand all the potential risks.
The views expressed in this report may change over time and updated reports will not necessarily be issued should this occur.
Red Line: “Roadmap” – A visual representation of proba-ble future price action. A perforated red line suggest various proba-ble outcomes with the perforated line being
Blue Line: Trend Lines that constitute important sup-port / resistance or break levels
TA – Target area
MA – Moving average
R – Resistance
RA – Resistance area
MR – Minor Resistance
MS – Minor Support
MTR – Medium Term Resistance
MTS – Medium Term Support
SA – Support Area
S – Support
T – Target
* or ** – Significance of level