
Global 10-Year Yields – The Bigger Picture – 20 June 2024
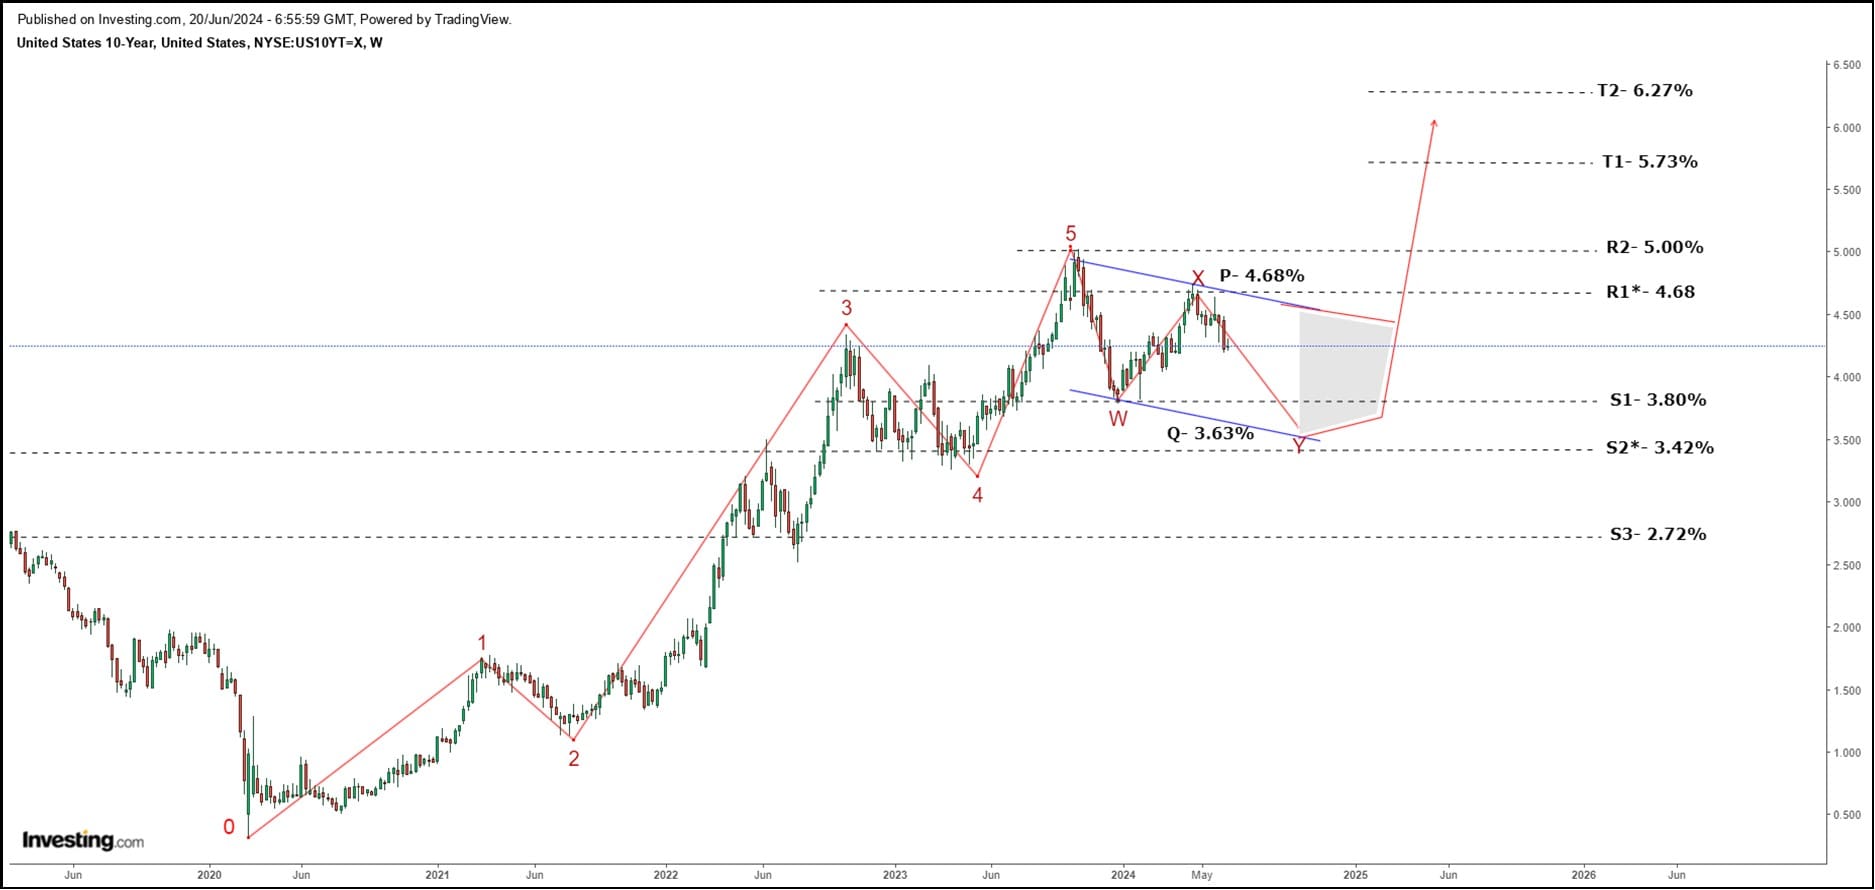
US 10 YEAR WEEKLY
|
EVENTUAL RE-EMERGENCE OF THE CYCLICAL BEAR TREND TO T1 AND T2
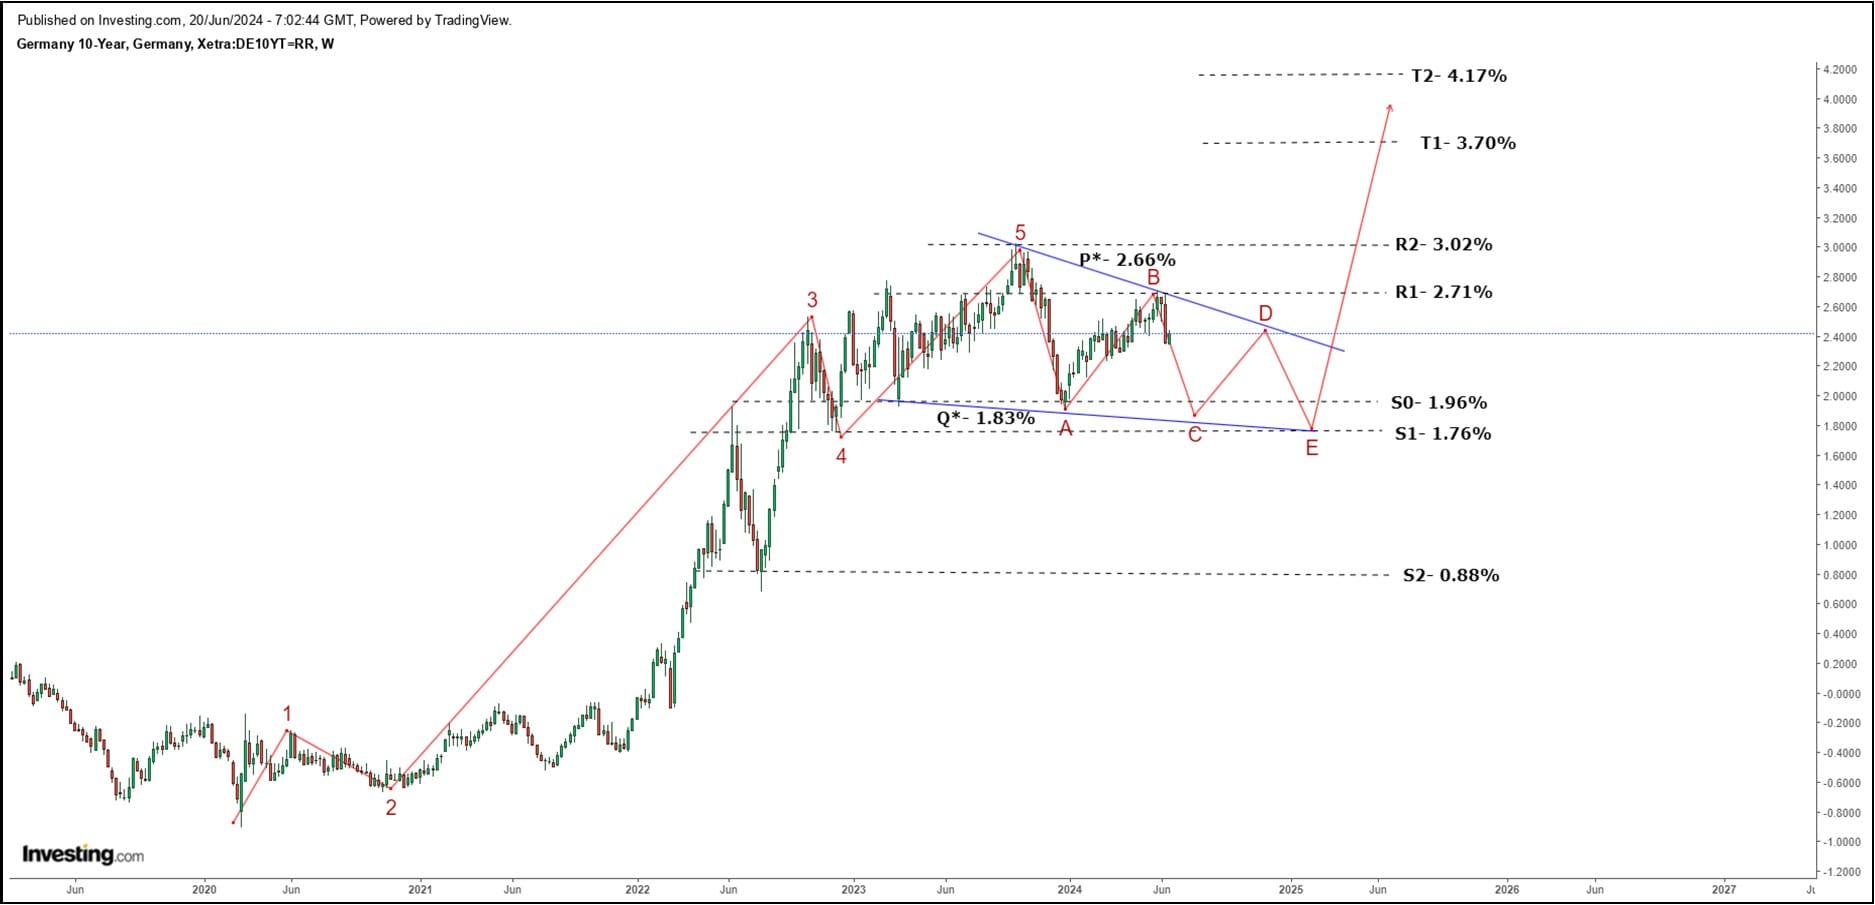
GERMANY 10 YEAR WEEKLY
|
EVENTUAL RE-EMERGENCE OF THE CYCLICAL BEAR TREND TO T1 AND T2
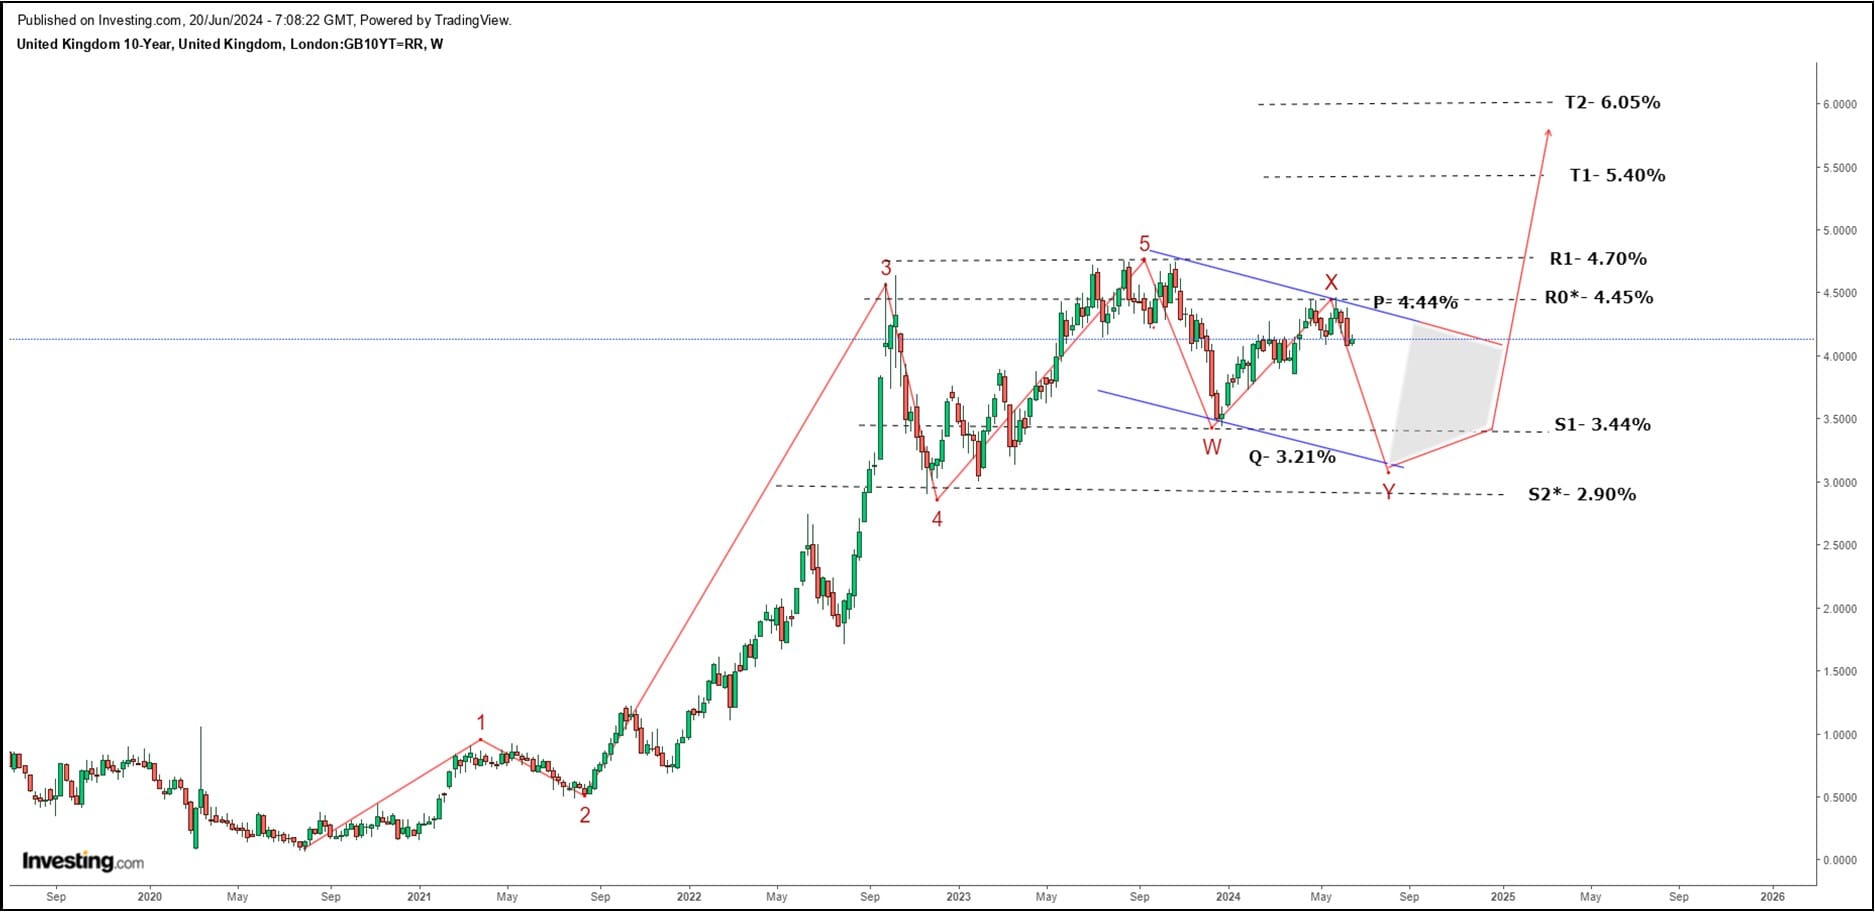
UK 10 YEAR WEEKLY
|
EVENTUAL RE-EMERGENCE OF THE CYCLICAL BEAR TREND TO T1 AND T2
This report is for informational purposes only, does not constitute an offer, or solicitation to trade and should not be construed as a recommendation, or advice, to enter into, or to refrain from entering into, any transaction.
Whilst the information herein contained is believed to be reliable, no responsibility is assumed by Hite Investments and Consulting, (Pty) Ltd., their employees, associates, external contributors, or any of the references used, for any errors, or omissions, or for losses of any nature which may arise from any opinion expressed herein.
You are cautioned that information is not necessarily complete and that opinions of individuals employed at the above may differ, or be based on contrary analysis techniques andthat opinions may change over time.
The losses in trading and investing can be substantial and you should not engage in such trading and investing unlessyou fully understand all the potential risks.
The views expressed in this report may change over time and updated reports will not necessarily be issued should this occur.
Red Line: “Roadmap” – A visual representation of proba-ble future price action. A perforated red line suggest various proba-ble outcomes with the perforated line being
Blue Line: Trend Lines that constitute important sup-port / resistance or break levels
TA – Target area
MA – Moving average
R – Resistance
RA – Resistance area
MR – Minor Resistance
MS – Minor Support
MTR – Medium Term Resistance
MTS – Medium Term Support
SA – Support Area
S – Support
T – Target
* or ** – Significance of level